Practical Tasks: Demographic data
|
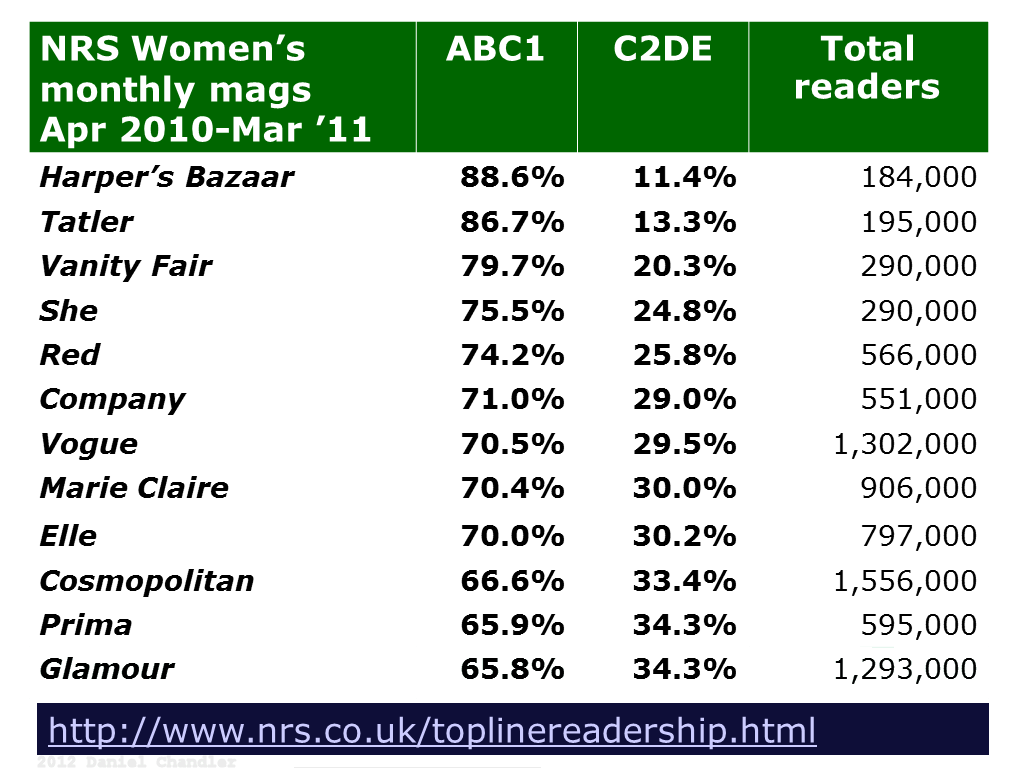
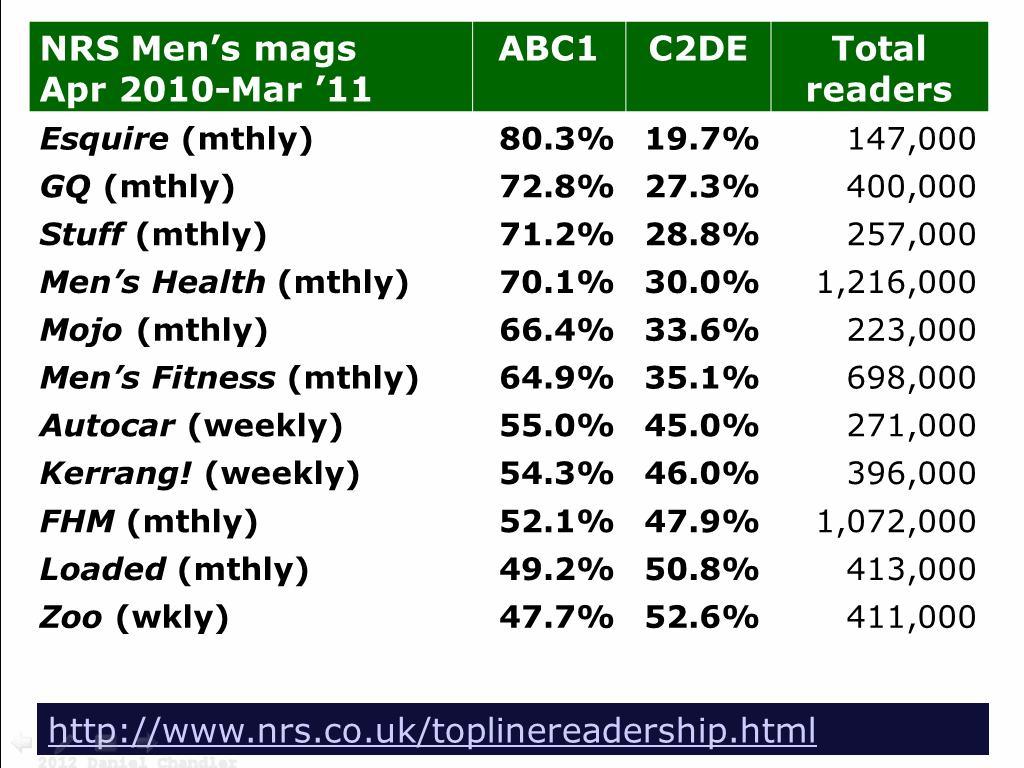
In both of your assignments you are required to present relevant demographic data. In the case of magazines, the most accessible source is the National Readership Survey. Comparative data can often be most effectively presented with bar-charts or pie-charts, but don't forget to add the necessary 'legends' to identify the different subsamples.
As in the examples of Tables 1 and 2 and Figures 1 and 2, you should present your data in the form of Tables and Figures, appropriately captioned. You should also indicate your sources, for instance in a List of Figures and a List of Tables after your References list.
Daniel Chandler
![]()
home ::
admin ::
lectures ::
practicals ::
reading ::
assignments ::
modules ::
tutor